
Sensor nodes to cloud dashboard — a building that knows itself.
A commercial building had no visibility into environmental conditions across floors. Facilities management was reactive — issues were discovered by occupants, not systems, and HVAC decisions were made without data.
The challenge
A commercial building had no visibility into environmental conditions across floors. Facilities management was reactive — issues were discovered by occupants, not systems, and HVAC decisions were made without data.
Our approach
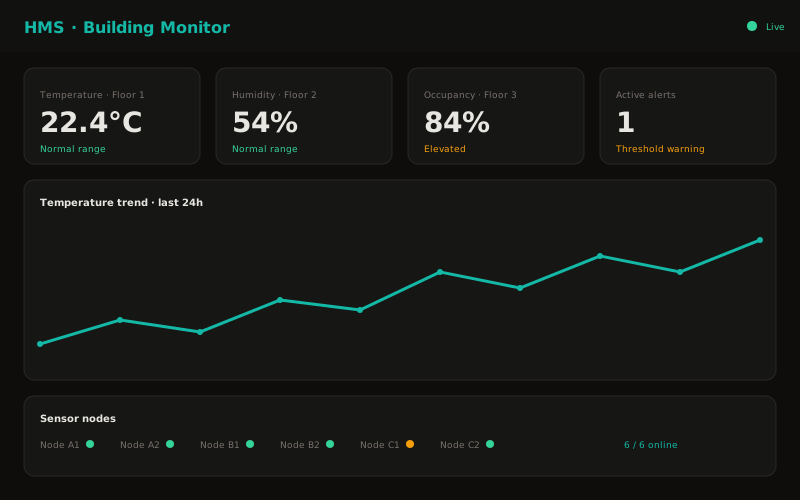
We deployed Arduino-based sensor nodes on each floor, streaming temperature, humidity, and occupancy data via MQTT to a cloud-hosted InfluxDB time-series database. A Grafana dashboard provides real-time monitoring with configurable threshold alerts.
Why this stack
- 01ESP32/Arduino nodes for low-power, low-cost sensing at <5W per unit
- 02MQTT broker for reliable, low-bandwidth telemetry across floors
- 03InfluxDB for high-cardinality time-series data
- 04Grafana for operator dashboards and threshold alerting
Results
- 24/7 monitoring across 3 floors with sub-2-second latency
- Threshold alerts reducing incident response time by 60%
- Historical data enabling HVAC optimization
- Sensor nodes running continuously on <5W per unit
“We went from reacting to complaints to seeing every floor in real time. The alerting alone has cut our incident response time in half.”
Have a problem that looks like this one?
We start every engagement with a clear brief and a straight timeline.